Behind the Scenes
Why Graph-Based Navigation?
Every digital comic has to answer one question first: what decides which panel comes next? Print says the page order, motion comics say the timeline, PanelWave says a graph. Here is why that choice serves readers better than either alternative, and why it costs a linear story nothing.
Underneath every feature in PanelWave sits one decision that was made before the first line of code: a chapter is not a sequence of pages, it is a directed graph. Panels are nodes. Edges say which panel may follow which, under what condition, with what transition. Everything readers and creators later see, from a simple next button to a branching mystery, is a consequence of that choice. This post explains why we made it, what the alternatives would have cost, and why a plain linear comic pays nothing for it. If you want the mechanics, the docs have them under Graph Navigation; this is the reasoning.
Three ways to say what comes next
Digital comics inherit one of two models. The first is the print model: a comic is an ordered list of pages, and reading means turning them. It preserves the art and the composition, but on a phone it means pinch and zoom, and it has no vocabulary for a choice; the reader's only decision is forward or back. The second is the video model, the motion comic: panels become shots on a timeline, with sound and movement, and the file plays. It gains motion and mood and loses the reader entirely. Someone else runs the clock, art competes with animation, and there is no door to open.
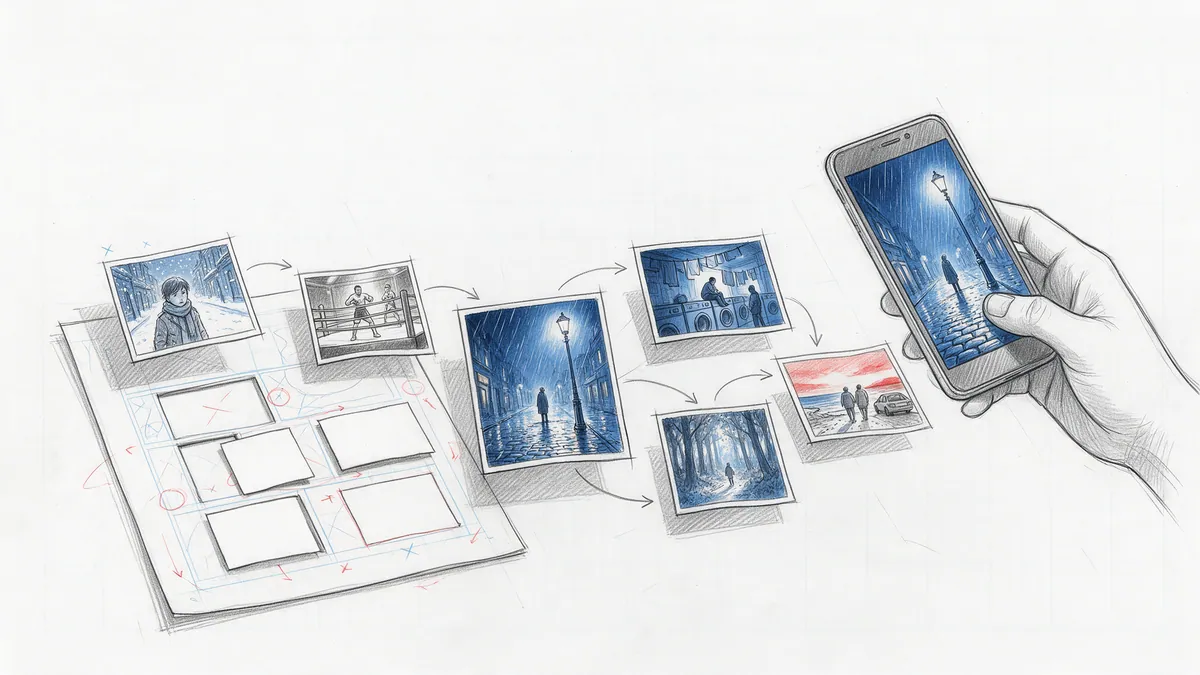
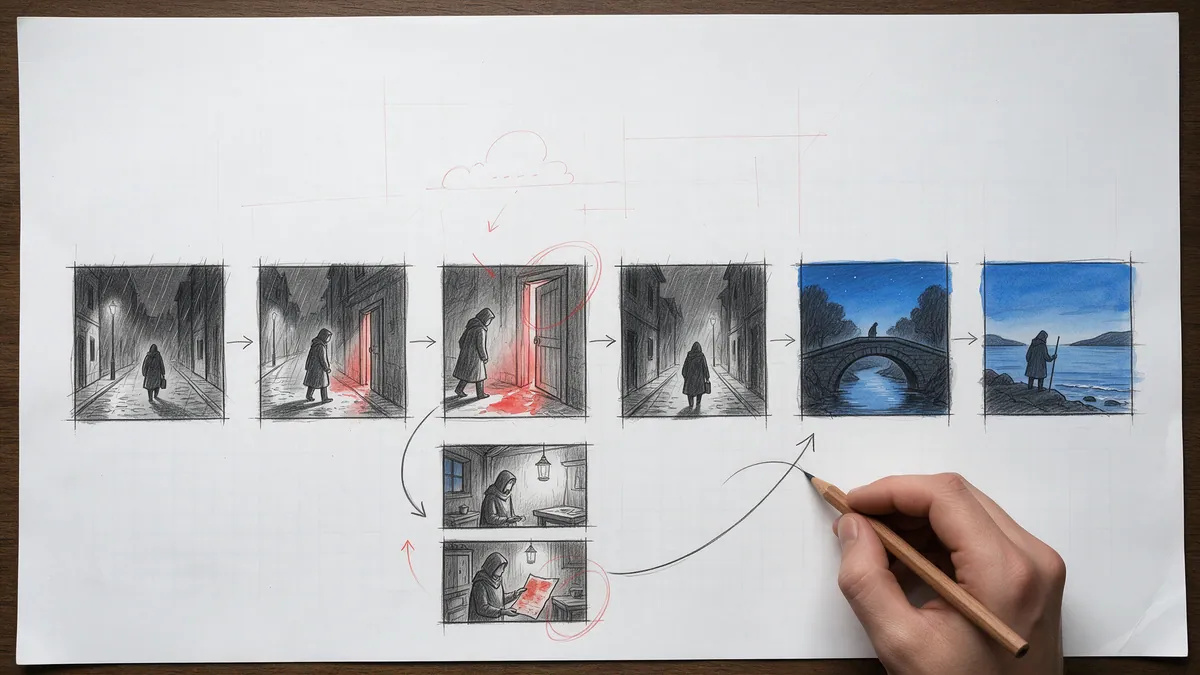
The third model is the graph. Each panel is a node with edges to the panels that may follow it. A linear story is a chain of unconditional edges, and a choice is a node with two or more outgoing edges whose conditions differ. Nothing about the model privileges one shape over the other, which is the point: the format does not have a normal mode and a special interactive mode. It has one primitive that describes both.
What a graph gives readers
The reader's experience follows from the model more directly than one might expect.
- Pace. A node is a stop. The reader advances when they choose to, or lets autoplay do it at a duration the panel or the reader sets. The art holds still while they look at it, unlike a shot on a timeline.
- Path. A detour is an edge that leaves the main line and another that rejoins it. Optional scenes, side alleys and secret rooms need no special machinery, and a reader always has a way back to the arc.
- Return. Because every step is an edge, going back is walking the same edge in reverse, including its transition. History and back-navigation work identically for linear and branched stories.
- Choice. A hotspot on a door records what the reader did in a variable; the outgoing edges of the next node ask about that variable. The choice is the reader's, and the format remembers it.
- View. The same graph renders one panel at a time on a phone or as a composed page on a large screen. Page view shows the placements the creator designed; panel view walks the nodes. The reader toggles freely, and the reader interface docs describe what each view does with next and previous.
What a graph gives creators
For the person making the work, the graph replaces special cases with data. A branch is not a script: it is an edge with a condition written as JSON Logic, a small rule that reads like a sentence. Choices are hotspots that set typed variables with a declared scope, and the same condition language that routes edges can also swap a panel's content through a variant or hide a single bubble. One language, learned once.
Pages did not go away. A chapter can still define page layouts with placements and a reading order, so the print composition survives and the print export still works. What changed is that the page describes how panels are arranged, while the graph describes how the story moves. The two are kept deliberately separate, and the format reference explains how they coexist under page view versus panel view. Reordering panels on a page changes their reading order; it never changes the graph.
And because the graph is data in a JSON manifest rather than logic in a program, it can be validated. Unreachable panels, dead ends, missing entry points and cycles are structural questions a tool can answer before a reader ever finds them. The Graph Editor in the CMS draws the graph as a map, flags those issues, and lets you simulate any path, and preflight validation repeats the reachability check before publishing.
"graph": {
  "entry": "panel-01",
  "edges": [
    { "from": "panel-01", "to": "panel-02" },
    { "from": "panel-02", "to": "panel-03-left",
      "condition": { "==": [{ "var": "story.choice" }, "left"] } },
    { "from": "panel-02", "to": "panel-03-right",
      "condition": { "==": [{ "var": "story.choice" }, "right"] } }
  ]
}
Why not a page order with jumps?
The obvious cheaper alternative is to keep pages and add a jump instruction: go to page 14 if the reader took the key. Interactive fiction tools have worked this way for decades, and for text they work well. For comics it breaks in two places. First, a jump is an exception to the order rather than part of the model, so every tool that understands pages has to be taught about jumps separately, and back-navigation needs its own bookkeeping. Second, jumps are usually code, which puts branching behind a barrier that most artists do not want to cross. In a graph, the edge is the order. There is nothing to add, and a visual editor can draw it without anyone writing a script.
Why not a timeline?
The timeline is tempting because it brings sound and motion for free, and PanelWave does use timelines, inside a panel, for animation and audio. The mistake is making the timeline the story's spine. A timeline has one direction and one speed, so agency has to be bolted on as pauses and menus, and the art never gets to hold still. A graph puts the timeline where it belongs: a node can have motion, sound, even video, and still be a place the reader stops at, explores, and leaves when ready. Motion serves the panel instead of replacing it.
What linear stories pay
Nothing. This was the test the design had to pass. A conventional comic in PanelWave is a chain of edges without conditions, which the CMS creates automatically as you add panels. The player walks it exactly like a branched one: collect the outgoing edges, evaluate their conditions, take the winner. With one unconditional edge per panel the evaluation is trivial, and the reader sees a comic that reads front to back. You only pay for complexity where you use it, and you can add a first branch to chapter three without restructuring chapters one and two.
One graph, three layers
The graph is also what lets an open ecosystem share one definition of a story. The format defines the graph as data, the player evaluates it at reading time, and the CMS draws and validates it. None of them needs to agree on anything beyond the manifest, and any third-party reader that implements the same rules gets the same story. That is the property we mean when we call the format the contract, described under Architecture. The manifest itself is small enough to read; the annotated example shows a complete work in a page.
The model is also the reason we are comfortable with what is still ahead. Panel variants that swap content by state, hotspots that act, paywall boundaries at exact positions in the story, and a reading view in which the space between panels becomes visible are all things you can add to a graph without changing what a graph is. A page order or a timeline would have needed a new model for each.
Further reading
- Graph Navigation: the anatomy of a graph, conditions, transitions and mutations.
- Graph: every property of the graph, edge and mutation objects.
- Chapters and Pages: how page layouts and the graph coexist.
- Variables: the state that edge conditions read.
- Graph Editor: drawing, validating and simulating the graph in the CMS.